Spain's growth in context
1.1 GDP (ForeCAST) vs. peer countries
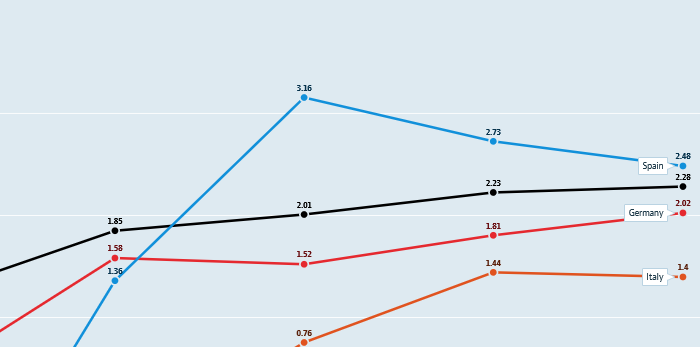
The OECD's GDP 2020 to 2030 (forecast) shows the differences between Spain and other comparable countries (please click/touch on the lines to identify the country and data points).
The forecast is based on an assessment of the economic climate in individual countries and the world economy, using a combination of model-based analyses and expert judgement. The indicator is measured in USD at 2010 Purchasing Power Parities.
OECD (2023), Real GDP long-term forecast (indicator). doi: 10.1787/d927bc18-en
1.2 GDP per Capita vs. peer countries
Spain's GDP per capita increased by CAGR 5% from 2016-19, outperforming Germany, the U.K. and Italy over the same period (4% respectively).
During the CoVID pandemic, Spain’s GDP per capita contracted by 12% between 2019 and 2020 (Germany -2%, Italy -6%, and the U.K. -7%).
From 2020 to ‘22, Spain and Italy have recovered at a CAGR of 11%, the U.K. at 9% and Germany at 6%.
GDP per capita data are measured in US dollars at current prices and PPPs.
OECD (2023), Gross domestic product (GDP) (indicator). doi: 10.1787/dc2f7aec-en
1.3 GDP ANNUAL GROWTH (forecast, REAL) vs. Peer countries
Spain's growth, according to the OECD is set to slow in 2018 and 2019.
Real gross domestic product (GDP) is given in constant prices and refers to the volume level of GDP. Constant price estimates of GDP are obtained by expressing values of all goods and services produced in a given year, expressed in terms of a base period. Forecast is based on an assessment of the economic climate in individual countries and the world economy, using a combination of model-based analyses and OECD judgement. This indicator is measured in growth rates compared to previous year.
OECD (2018), Real GDP forecast (indicator). doi: 10.1787/1f84150b-en
Drivers of growth in SPAIN
According to the IMF in 2015, growth in Spain between 2014 and 2016 has been driven by low oil prices, low interest rates and structural reforms. However problems and political uncertainty remain which is limiting growth and investor confidence.
Drivers of growth
Depreciation of the Euro
Lower oil prices
Exports (Strengthening trading partners)
Growth in private consumption
Rising employment and incomes
Household tax cuts
Low interest rates
Current account surplus
Financial sector reforms
However deep structural problems remain
Labour market challenges
A number of obstacles which prevent domestic market consolidation and economies of scale
High levels of private and public debt (235% and 98% of GDP in 2015, IMF)
Please click through to the summary of debt indicators
Can't see what you're looking for? Or not enough detail? Please contact us with your enquiry.